Graphviz Examples
You may also like to read about Flowcharts in Graphviz.
Sketchviz uses Graphviz, which translates descriptions of graphs written in the DOT language into images. The official documentation is a great reference, but a poor tool for beginners. Instead, we've written this Graphviz tutorial that provides an introduction to its most useful features. You can click any image to launch an interactive editor of that graph.
The Basics
A graph is a collection of nodes and edges. You can create edges between nodes with the -- or -> operator. By default, a node's label is its name.
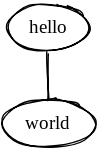
You can have a graph, which uses --:
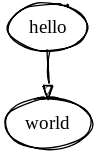
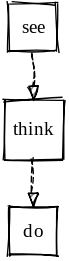
Or a digraph, which uses ->:
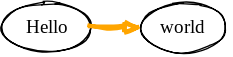
The presentation can be customized by specifying attributes. Attributes for the graph as a whole come at the top of the graph declaration, while attributes for nodes and edges come in square brackets immediately after they are declared.
Graphviz itself supports any font, but for our hosted graphs to work, you'll need to stick to one of these three fonts:
- Tinos (this is the default)
- Handlee
- Sedgwick Ave
For convenience, any text contained in asterixes (*like this*) will render in the Segdwick Ave font.

You can provide defaults for nodes and edges to avoid repeating yourself:
Advanced Graphs
Congratulations, you now know enough to make useful graphs! These next tricks can come in handy, but don't feel like you need to learn them immediately.
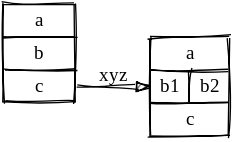
Records
Nodes with shape=record are treated specially. These are useful for displaying tables and object layouts. Note that you need to use ports, signified by <angle-brackets> to create edges to and from records.
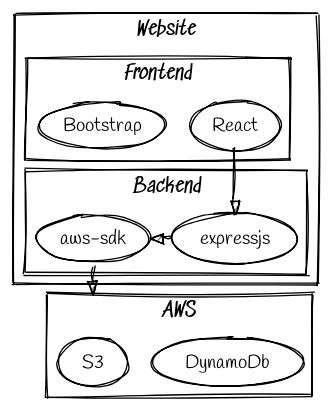
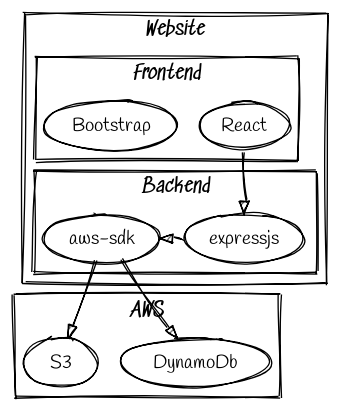
Clusters (or Subgraphs)
You can group related nodes by putting them in a subgraph whose name begins with cluster_.
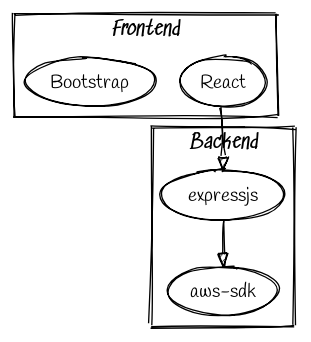
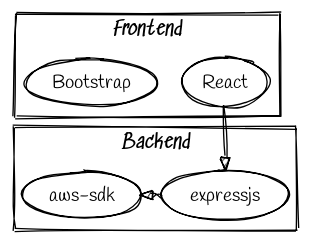
Yuck, that didn't lay out very nicely! We'll add constraint=false to the edge between expressjs and aws-sdk to let Graphviz know that the edge doesn't imply that expressjs should be ranked higher in precedence:
Clusters can also be nested:
If you'd like your arrow to start or stop at the cluster boundary, you have to set compound=true and use the lhead or ltail attributes on the edge: