Guide to Flowcharts in Graphviz
You may also like our beginner Graphviz tutorial.
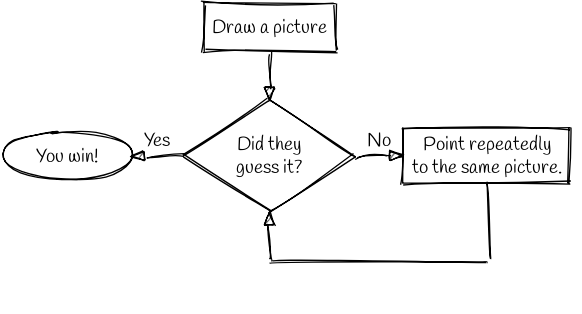
Flowcharts are a common way to visually explain the set of steps in some process. Graphviz can be used to draw flowcharts, although it can be fiddly if you want pixel-perfect layouts.
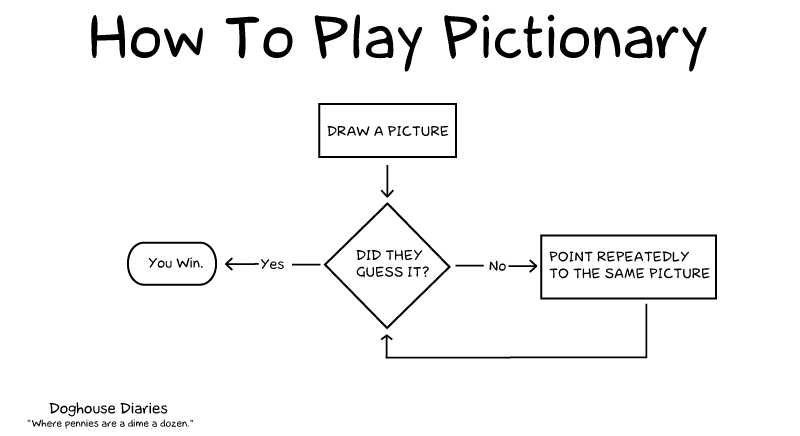
This guide will recreate the classic "How To Play Pictionary" flowchart from Doghouse Diaries:
A first attempt
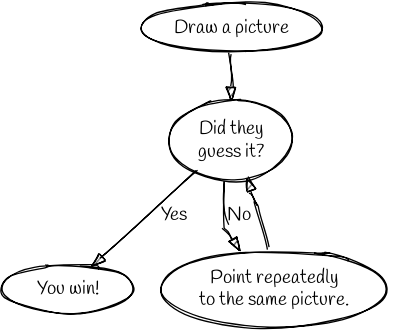
Let's create a graph with the necessary nodes and edges.
Taking shape
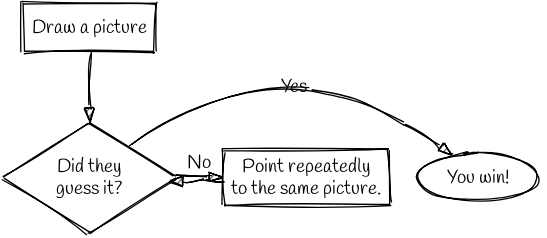
It's OK, but it's not as nice as the image...yet! Let's make the shapes match via the shape attribute, and put the bottom three entries on the same row using rank=same.
Winners to the left, please
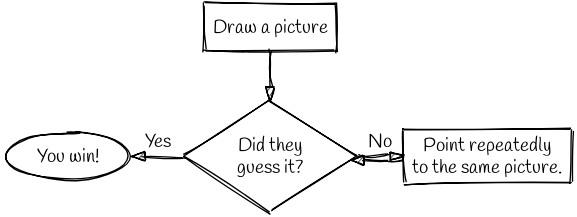
Now there's a very long edge from the guess node to the win node. This is because digraphs are directed -- since the two nodes are on the same rank, the "from" node appears to the left of the "to" node. The solution is counter-intuitive: reverse the connection, so the edge runs from win to guess. Then tell Graphviz to render the arrowhead on the tail instead of the head via dir=back.
"No" breathing room
You're probably pointing at the transition to and from the pointing node now, right? It's hard to tell which edge that "No" belongs to. We can use ports to tell Graphviz where to connect the edges. By default, every node has a port for each of the points on the compass rose (n, e, s, w, ne, se, sw, nw) and one for the centre of the node (c). We can specify a specific port by putting a colon after the node name, and then the name of the port:
Squaring things up
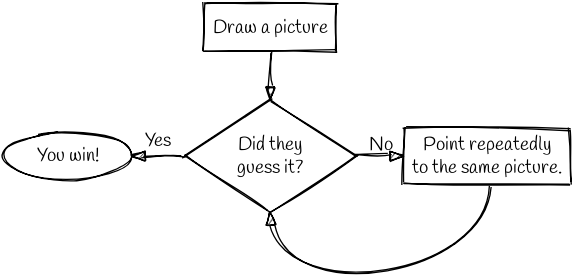
We're almost there! The last thing to do is to change the edge to be at right angles instead of curvy. To be honest, if you need this level of pixel-perfect layout, Graphviz is probably not your best choice. Still, let's do it anyway! To achieve the effect, we're going to create some invisible nodes, then route the edge via those nodes. We'll also use the splines=false setting, and target the n port. (A useful exercise: click the image to open the graph in the Sketchviz editor, then experiment to see what happens if you remove either or both of those settings.)
Perfect! Go play some Pictionary!
